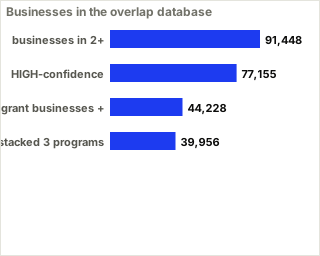
The searchable companion to the program-overlap chart: all 91,448 businesses that drew on two or more of PPP, EIDL, RRF and SVOG — $60.9 billion combined.
PPP, COVID-EIDL, PPPLF and Main Street ran on different rails and failed in different ways: eleven charts comparing the four by channel, geography, controls and afterlife.
COVID-EIDL explorer: 3.68 million direct SBA loans, $370.3 billion in face value, a $44.6 billion expected cost on the government's books (an estimate, not losses), by state, month, size and type.
Of 1,977 classified pandemic relief-fraud cases, 246 carry identity-theft indicators — 12.4% of prosecuted cases, a lower bound. Among the 849 cases tagged to EIDL, the rate rises to 16.1%.
A PPP application advertised in about five minutes, 3.7 million GAO-flagged PPP and EIDL recipients, 937 federal benefits-fraud sentencings in fiscal 2024.
SBA OIG, GAO, and the conviction record measure PPP fraud with numbers 100x apart — >$200B flagged, ~$36B 'likely' across SBA's pandemic programs, >$2B charged.
An interactive that lets you pick which relief programs to count and at which bar — flagged as potential fraud, judged likely, or charged in federal cases.
A dated visual record of the pandemic small-business moment, 2020–2022: 11 street photographs set against six captures of online loan portals and their marketing.
109 program-figures across 24 countries from a 114-row primary-source register: fraud and error rates that measure different things, rescue size where a source stated it, and who each country paid.
Blueacorn and Womply facilitated 1.07 million of the 1.32 million PPP loans made through community-development lenders, reaching low-income and HUBZone tracts at about twice the banks' rate.
Weekly 2021 PPP approvals at three Womply partner lenders and Blueacorn’s two, from SBA loan-level data: second draws came a median 23 days after the first, vs 49. Lines are upper bounds.
From the 1976 confidentiality wall to a real-time API that met its deadline for individual transcripts, left the business half at least six months behind, and could be used by the 6.6% of IVES taxpayers who had the IRS online account it requires: how relief programs were designed to move money before the IRS could check it. Thirty-six events, each tagged legislative, executive, operational, or oversight.
The Relief Machines — Contractors
Open ↗
No matching interactives
Try a wider question.
Change the search or clear the filters to return to all 28.